Why borrowers prefer informal fund sources
 Philippine banks reach far too few Filipinos, particularly in the countryside. People either refuse or are simply unable to keep the money they have in banks because branches are too far, or in many cases, too intimidating for average Filipinos.
The Bangko Sentral ng Pilipinas’ (BSP) inaugural National Baseline Survey on Financial Inclusion sought to measure the extent of the problem. Its results are troubling. One in four Filipino adults has never experienced saving money in any form, while seven in 10 of those who save choose to keep their money at home.
The banks’ failure to serve a broader market exposes many Filipinos to loan sharks that charge exorbitant interest rates. Many also fall victim to numerous Ponzi schemes due to lack of education. It’s a big market out there, and banks should work hard to provide the necessary services that Filipinos need. If banks won’t, others—some unscrupulous—will.
The following are the highlights of the BSP’s National Baseline Survey on Financial Inclusion:
Access
Filipino adults are most aware of banks (98.3 percent), pawnshops (95.7 percent) and automated teller machines or ATMs (93.5 percent). There is relatively low awareness of other access points such as microfinance NGOs (30.5 percent), e-money agents (25.6 percent) and nonstock savings and loans associations or NSSLAs (13.6 percent).
Among those who are aware of access points, seven out of 10 adults said banks were accessible. However, other access points such as payment centers, ATMs, pawnshops, money changers and remittance agents are perceived to be nearer and easier to reach. The least accessible financial service providers are NSSLAs and insurance agents/companies.
The most typical means of reaching an access point is through public transportation, either via three-wheeled or four-wheeled vehicle. Some access points such as cooperatives and e-money agents are most commonly reached by walking only. On the average, it takes 21 minutes to go to the nearest access point. In terms of cost, the average roundtrip fare to reach an access point is P43 ($1).
The average length of time to reach the nearest bank and ATM is 26 minutes and 22 minutes, respectively. A two-way trip to the nearest bank and ATM costs P52 and P47, respectively. Length of travel time and cost of travel are lower for other access points such as remittance agents and payments centers.
Financial transactions
For those who are aware of access points, a majority (71 percent) have transacted with payment centers, remittance agents (58.6 percent) and pawnshops (51.6 percent). Among adults who have performed financial transactions, the most commonly experienced transaction is paying bills (72.3 percent), followed by sending/receiving money (62.5 percent) and withdrawing cash (56.4 percent).
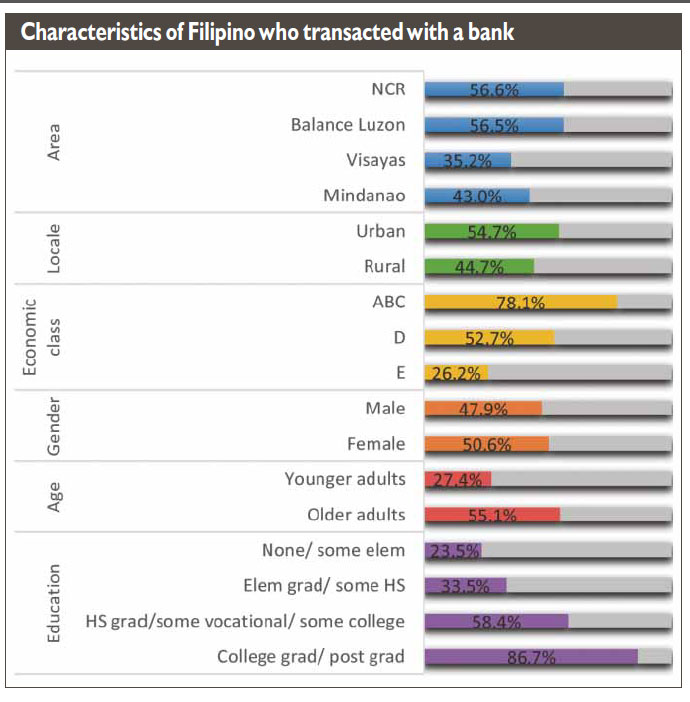
Five out of 10 Filipino adults have experienced transacting with banks. In Metro Manila and the rest of Luzon, more than half of the adult population has performed banking transactions, 35 percent of adults in Visayas and 43 percent of adults in Mindanao. Some 55 percent of adults in urban areas have done banking transactions compared with 45 percent in rural areas. The percentage of adults who have experienced transacting with a bank is decreasing as we go to lower levels of income and education. The percentage is higher for females and older adults.
There are geographic peculiarities in financial transactions. For instance, many adults in Mindanao have transacted with cooperatives and microfinance NGOs. The percentage of adults who have performed transactions in NSSLAs and pawnshops is relatively high in Visayas compared with other regions. While the percentage of those who have experienced transacting with access points is often higher in urban areas, it was noted that more rural clients with transactions in cooperatives, microfinance NGOs and e-money agents.
There are also disparities in terms of economic class. The percentage of adults who have transacted with access points is usually higher in class ABC except for NSSLAs, cooperatives, lending/financing companies and payment centers where we observed more adults coming from class D. Adults who have an experience in transacting with microfinance NGOs are mostly coming from class E.
Savings Four out of 10 Filipino adults currently have savings. Around 32 percent used to save in the past but have stopped saving money, while the remaining 24.5 percent never experienced saving money.
 Seven out of 10 adults who save keep their savings at home. Only 32.7 percent of adults with savings put their money in banks while others save through cooperatives (7.5 percent), NSSLAs (0.8 percent) and informal savings groups (2.6 percent). The main purpose of saving money is to have something to use in case of emergencies (63.8 percent). Most adults are also saving for future expenses on food (55.6 percent) and education (47.4 percent).
Six out of 10 adults with bank account indicated that the bank’s reputation is their number one consideration in opening a deposit account. About 50 percent mentioned interest rate as another major consideration, followed by minimum maintaining balance (45.9 percent), proximity of the banking office (39.8 percent) and the way the bank employees treat their clients (34.8 percent).
About 65 percent of unbanked adults cited lack of enough money as the main reason for not having an account in a bank. The other reasons include the lack of need for a bank account (16.9 percent), limited knowledge and capability to manage an account (16.8 percent), cost (11.2 percent), distance of the bank (7.6 percent), lack of documents (4.6 percent).
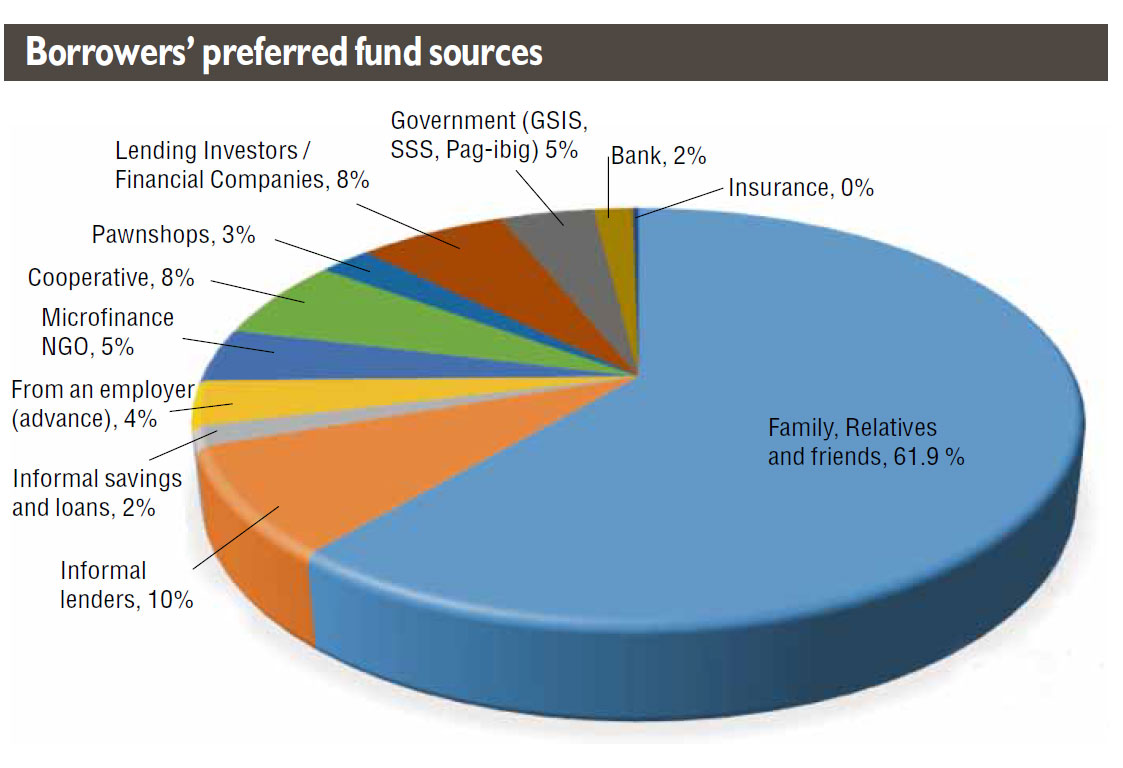
Loans The majority of Filipinos have or had debt—47.1 percent of adults borrow money, while 33.8 percent did so in the past and do not borrow anymore. Only 19.1 percent of adults do not borrow at all. For those who borrow money, the main sources of funds are family/relatives/friends (61.9 percent) and informal lenders (10.1 percent). Bank as source of borrowing stood at 4.4 percent, lower than the percentage of adults who borrow from lending/financing companies (12 percent), cooperatives (10.5 percent), microfinance NGOs (9.9 percent) and government entities (6.1 percent). The main purpose for borrowing money is to buy food (59.5 percent), school related expenses (38 percent) and to finance emergencies (32.7 percent).
Half of the adult population with outstanding loan in a formal financial institution has a personal loan which was reported to be commonly sourced from lending/financing companies. Other common types of loan among adults with outstanding credit are microfinance loans (20.2 percent), salary loans (19.5 percent) and business loans (12.9 percent).
The primary considerations in borrowing money are interest rate (57.5 percent), loan amount (41.7 percent), period to pay for the loans (35 percent) and ease of loan application (33.1 percent). Reputation of the credit institution or lender (24.5 percent), amortization (14.9 percent), collateral (14.3 percent) fees and other charges (11.4 percent), and processing time (11 percent) are also considered.
Payments and remittance Person-to-person Filipino adults are most aware of ATMs as means of sending and receiving money or remittances to/from persons. About 69 percent are aware of ATMs, followed by pawnshops (65.5 percent) and remittance agents (62.4 percent). Among those who are aware of remittance channels, more people have experienced using remittance agents at 63 percent, followed by pawnshops (51 percent) and ATMs (38 percent).
Some 44 percent of Filipino adults have remittance transactions in the past six months. Most of the remittances are on the receiving side which comprise 59 percent—23 percent both sent and received money while the remaining 18 percent sent money only.
For those who sent remittances in the past six months, 91 percent sent to their families while 6 percent sent to their friends. For those who received remittances, 90 percent received from their families while 7 percent received from friends.
The purpose of the remittances received is mainly for food (71 percent). Some other uses are for education (39 percent), medical expenses (28 percent) and emergencies (22 percent). Very few cited purpose for productive use like buying assets (13 percent) and start business (6 percent).
Person to government (P2G), person to business (P2B), government to person (G2P) and business to person (B2P) transactions
Filipino adults are most aware of ATMs (48.2 percent) as delivery channel for sending and receiving money or payments to/from government and businesses. Among those who are aware of delivery channels for payments, percentage of those who have used the delivery channel is highest for bayad centers at 69.5 percent, followed by remittance agents (30.5 percent) and ATMs (30 percent).
Some 42 percent of Filipino adults made payments in the past six months. About 72 percent sent payments to the government or businesses, 14 percent received payments from the government or businesses, while another 14 percent both sent and received payments.
About 45 percent of P2G transactions are for payments of water and electricity bill, 35 percent are loan payments, 15 percent are for licenses while 11 percent are for taxes. The bulk of these payments are made in cash.
Some 94 percent of P2B payments are bills payments (utilities, tuition, insurance). The other P2B payment activities are loan payments (11 percent) and purchases (1 percent). Delivery channels most often used to pay bills are the bayad centers, cash for loan payments and remittance agents for purchases.
About 44 percent of G2P transactions are for the Conditional Cash Transfers (CCTs) of the Department of Social Welfare and Development (DSWD); 27 percent and 15 percent are for salaries and pensions for employees, respectively. Other payments include loan disbursements (12 percent) and benefits (8 percent). Delivery channel most often used to receive payments (from CCTs, salaries and pension) for G2P transactions is the ATM.
For B2P payments, 48 percent are for salaries while 30 percent are for loan disbursements. The majority of payments are made domestically and the delivery channels most often used by businesses are those linked to banks (ATM, checks and over-the-counter) aside from cash.
Insurance Filipino adults see illness and medical expenses as major threats that can significantly impact their livelihood (87.5 percent) and would like to have insurance coverage (48.6 percent). Next in rank among the perceived threats are death or loss of income from main income earner (75.6 percent) and natural disasters (59.1 percent).
Filipino adults are most aware of health insurance (77.7 percent), life insurance (67.3 percent) and accident insurance (60.3 percent). There is low awareness of microinsurance (14.5 percent), lower than other nonlife insurance products like vehicle (47.4 percent), fire (39.1 percent) and building (32.2 percent) insurance, but slightly higher than cellphone insurance (9.5 percent).
In terms of coverage, 21.7 percent of those who are aware of microinsurance have coverage either as directly insured or as beneficiary. This level is second only to health insurance, wherein 39.8 percent of those who are aware have coverage. The next highest coverage includes life insurance (20.8 percent), vehicle insurance (19.2 percent) and accident insurance (19.2 percent).
The most common reason given for not having life, health and accident insurance is lack of money. The second most common reason is the perception of high cost. The most common reason for not having vehicle insurance, building insurance, cellphone insurance and microinsurance is the lack of need for these types of insurance products.
Satisfaction with financial transactions
More than 50 percent of adults who have transacted with banks and ATMs are just somewhat satisfied with their transactions. The same is true for other access points, except for NSSLAs and cooperatives where there are more clients who indicated that they are very satisfied. The percentage of adults who are dissatisfied with financial transactions are highest among insurance agents (7.9 percent), payment centers (8.1 percent) and lending companies (9.2 percent).
Experiencing problems is most common in ATMs (21.9 percent), followed by cooperatives (17.1 percent) and microfinance NGOs (16.5 percent). Clients are just somewhat satisfied with how the issues were resolved in most access points, except in pawnshops where they are very satisfied and in insurance agents where they are dissatisfied.
Sources of information
The three most common sources of information about fees in financial transactions are notices/flyers/brochures, bank/office staff and word of mouth. Other modes such as signage/billboards and Internet appear effective in disseminating info on fees for remitting money, account transfers and foreign exchange. Receipts are also good sources of information for fees in account balance inquiry, bills payment, cash withdrawal and insurance.
Word of mouth and television are the main sources of awareness for P2P, P2B, P2G, G2P and B2P transactions, across all delivery channels.
Fees and charges
The charges in financial transactions are just right according to most adults except for some transactions such as performing money transfer between bank accounts which is perceived to be expensive.
Fees on deposit accounts are perceived as just right with some exceptions: Most of the holders of payroll accounts and time deposit think that the fees involved in their accounts are expensive.
Interest rates and fees on loans are assessed as just right, except for the fees in housing loans and credit cards which are perceived to be too expensive. Interest rate, loan amount, net proceeds and period of the loan are the common elements of the loan transaction which were explained to the borrowers.
There is a positive perception on the transparency of rates and fees for payment and remittance. For payments, remittance agents, ATMs and computer (i.e. online transactions) are perceived to be very transparent. For remittance, pawnshops are perceived to be the most transparent in rates and fees at 55 percent perception of very transparent, followed by banks— over the counter (45.3 percent) and ATMs (41.7 percent).
Experience in getting a financial product
Around 10 percent of bank account holders indicated that they were offered other financial products during account opening. The most common products presented to them are investments and loans.
Nearly 8 percent of those with outstanding loans stated that they were offered other financial products (mostly insurance and savings) by the financial institution during loan application. Most adults indicated that the amount of loan they received is the amount they requested. In cases when the requested amount was not approved, the amount granted was lower than the amount originally requested.
About 2 percent of respondents reported that they tried to save in a financial institution but their account application was denied. Some 3.6 percent of those with outstanding debt reported that they experienced a challenge in obtaining credit from financial institutions. Only 1 percent of respondents stated that their insurance application was denied. Lack of documentary requirements was one the common reasons for denied application in these three financial products.–Paolo G. Montecillo