

Successful companies know that the trick to crafting compelling and authentic stories is not based solely on intuitive decision-making. A good leader knows that, in order to remain competitive and relevant in this ever-changing business landscape, he or she must learn to embrace the paradigm shift. Nowadays, major organizations use data visualization and storytelling not just to streamline their operations or boost sales, but also consider it as the first step to real marketing.
However, not everyone in the business world understands the value of information that comes with this type of methodology. While data scientists can easily crunch numbers and build models, the problem usually occurs when it’s time to explain those insights to stakeholders and decision-makers alike. In a one-on-one interview with INQUIRER.net, TEDx speaker and StoryIQ cofounder Isaac Reyes talked about the importance of data in storytelling, its impact on the business culture, and the balance between simplicity and complexity.

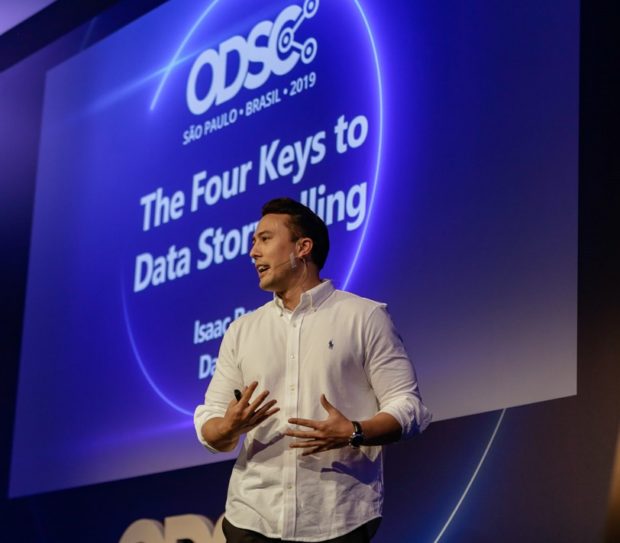
Image from: Vizcon.org
According to Reyes, data supports the narrative. It’s a way of using data and statistics to prove a hypothesis and make a solution out of these units of information.
“Without data there is no visualization, data is highly important for creating visualization in the business setting. It’s becoming increasingly important because businesses are realizing that they need to make decisions that are data-driven rather than based on hunches,” Reyes explained.
Easier to understand
Since the goal of data visualization is to provide a solution or present a story that is easier to comprehend, Isaac Reyes shared some tips on how to focus people’s attention on the numbers that really matter.
“To keep things simple, I’d say, take a step back and think about your most important metrics. Once you decide on those metrics, try to present them in the simplest way possible. I often apply what I call, ‘My Mom and Dad Test.’ Will my mom and dad understand this report? And if they would, I think I have got a good report that is suitable for presentation to the wider business audience.”
He also added that you should choose the right visual or metrics, according to your purpose.
“Choose simple metrics that everyone understands then present those metrics using charts and tables in a way that is super understandable and that’s actually what we are gonna be covering at the conference. We are gonna be talking about how to balance simplicity and complexity,” Reyes said.
Why attend VizCon2020
To be a better data presenter, StoryIQ (formerly DataSeer) in partnership with SMX Convention Center Manila brings you the Philippines’ first data visualization summit this coming March 3 at SMX MOA.
As part of the organization’s mission to empower the world in telling better stories with data, they invited international and local thought leaders to talk about the essential elements of data, the importance of metric selection, and more.
“It’s the first data visualization and business intelligence summit so we are really excited about it. We are going to have thought leaders from all around the world, flying in for the conference and they are gonna be talking about methodologies. What are the best ways of presenting data based on everything we have learned in the last few decades. They are also gonna be talking about tools,” Reyes expounded.
Besides feature talks and panel sessions, the other main thrust of the agenda is workshops.
“We are big on making sure that this is not just sharing of ideas but it is also a sharing of applicable skills and so those who attend will get a real view of how it is done hands-on.”
For more details about VizCon2020, you may sign up at vizcon.org.
INQUIRER.net BrandRoom/TV