Dar’s agriculture targets can be achieved
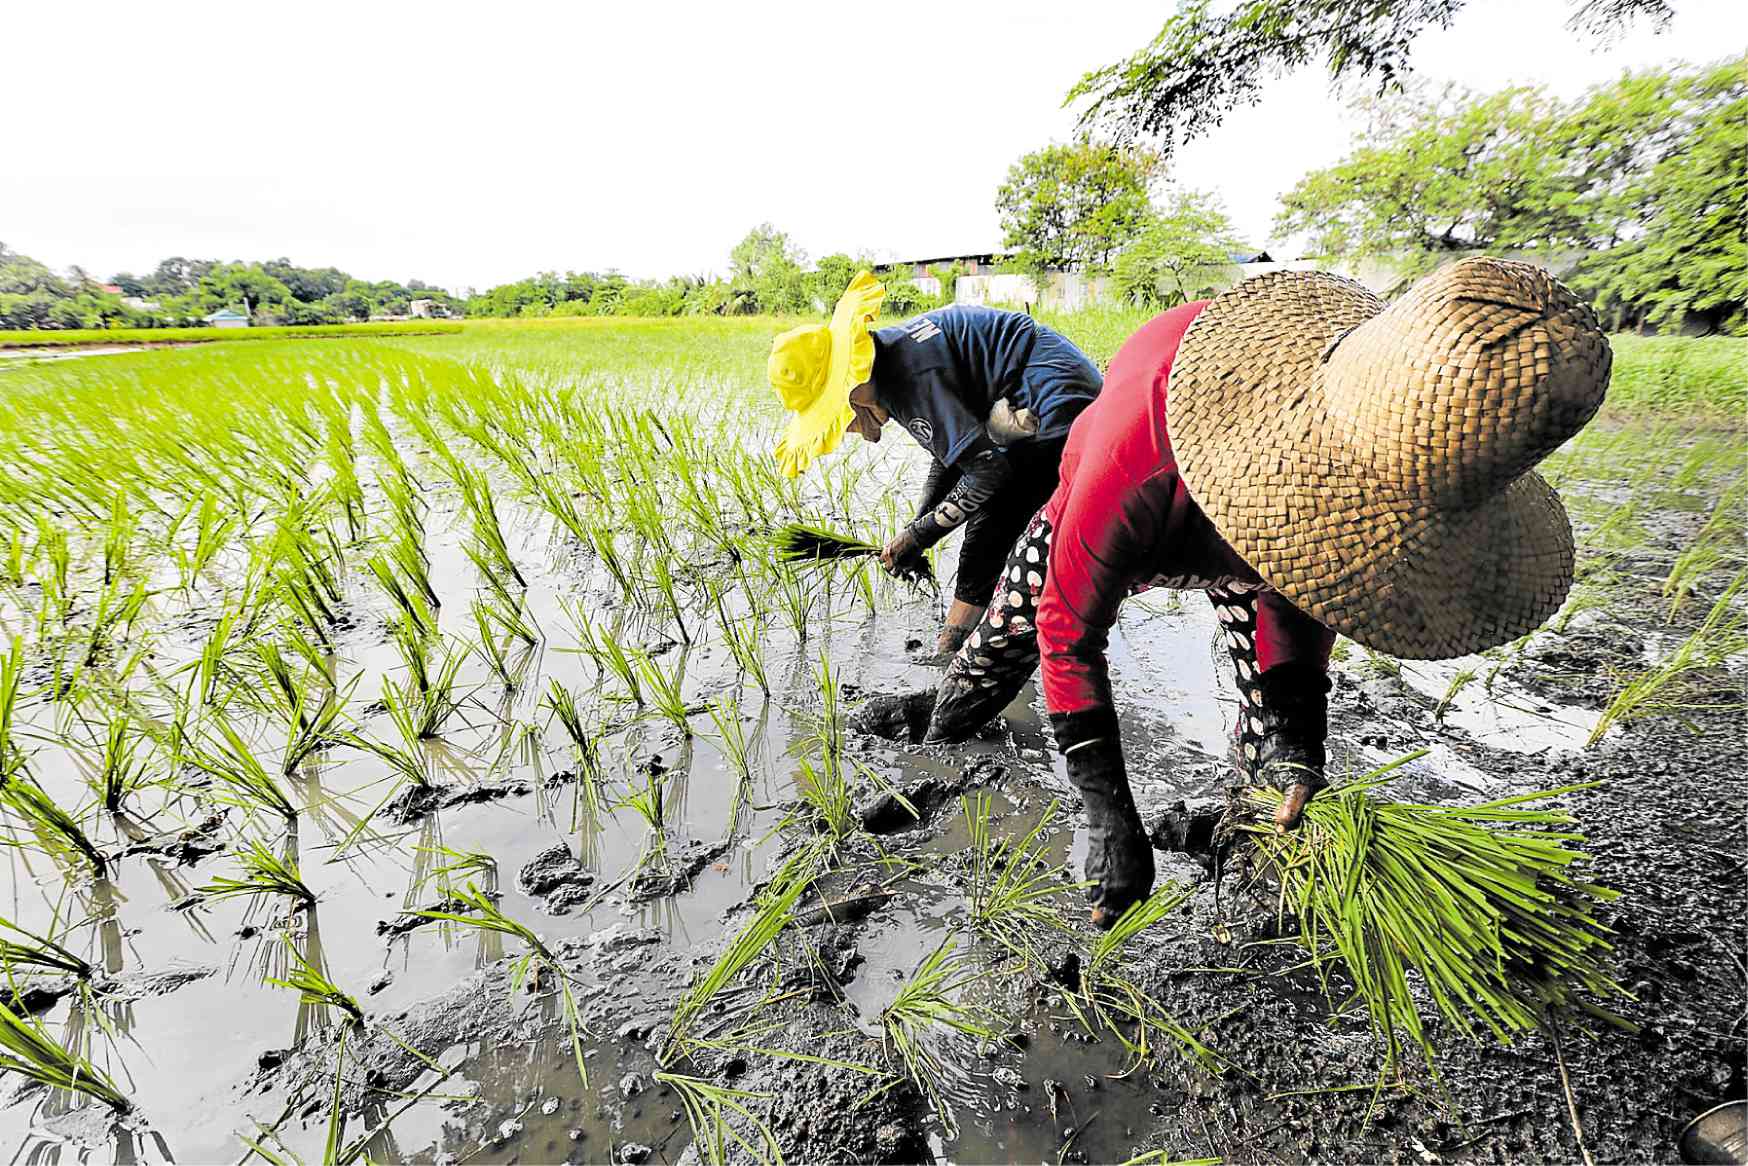
In this file photo, farmers in Pulilan, Bulacan, continue to tend to their fields despite suffering heavy losses as a result of the rice tariffication law that has brought down the farm gate prices of palay. —GRIG C. MONTEGRANDE
The new head of the Department of Agriculture, William Dar, targets agriculture growth at 2 percent in his first year, 3 percent in the second year, and four percent in the third year.
Are the targets doable? We consider two empirical bases. One is the Asean peer experience; and the other, sources of Philippine agriculture growth.
Asean experience
Within 30 years, the Philippine growth record was the poorest among its peers. Indonesia and Vietnam were way on top. Malaysia experienced massive shift from rubber to oil palm, thus slowing down growth.
The Philippines was set back by the 6.4-percent contraction during the 1998 drought, but recovered by 9.6 percent in 1999 and 3.4 percent in 2001. Thailand posted a slowdown from 2011-2016 and the sector specifically fell 6.5 percent in 2015 due to a severe drought.
The Philippine slowdown was notable from 2011 to 2016. While Indonesia and Vietnam were posting three to four percent a year, the Philippines barely grew at 1.2 percent.
It is too early to judge the first three years of President Duterte. This year also remains stagnant.
Comparative average annual growth rates: Asean agriculture, 1987-2018
Philippines
1987-1992 – 1.95
1993-2000 – 2.09
1987-2000 – 2.02
2001-2010 – 2.87
2011-2016 – 1.19
2017-2018 – 2.42
Indonesia
1987-1992 – 3.44
1993-2000 – 4.04
1987-2000 – 3.13
2001-2010 – 3.47
2011-2016 – 4.02
2017-2018 – 3.90
Malaysia
1987-1992 – 1.32
1993-2000 – 0.88
1987-2000 – 1.06
2001-2010 – 3.14
2011-2016 – 2.20
2017-2018 – 3.39
Thailand
1987-1992 – 4.59
1993-2000 – 2.32
1987-2000 – 3.30
2001-2010 – 2.43
2011-2016 – 0.28
2017-2018 – 4.36
Vietnam
1987-1992 – 3.36
1993-2000 – 4.26
1987-2000 – 3.87
2001-2010 – 3.46
2011-2016 – 2.83
3.33
Source: World Bank
Sources of PH agriculture growth
Growth has not been sustained since 2010. It grew an average of 2.87 percent a year from 2001 to 2010 (under President Gloria Macapagal Arroyo), 1.19 percent from 2011 to 2016 (under President Benigno Aquino, Jr.) and 2.42 percent from 2017 to 2018 (under President Duterte).
It is premature to judge Mr. Duterte’s record. It benefited from a postdrought recovery of almost 4 percent in 2017, but slid by 0.9 percent in 2018, and likely flat in 2019, for an average of 1.6 percent.
The Arroyo period fostered balanced growth for crops, livestock, poultry and fishery. The Aquino years recorded an altered state: crops (fueled by rice), livestock and poultry were the drivers, but fishery went through a deep decline. The early period of the current administration depended heavily on crops (rice) and the rapid growth of poultry.
A notable development over the years is the consistent growth of livestock and poultry as the products are income-responsive.
However, there was little contribution from other crops. The latter has bigger physical area (about 4 million hectares) than rice of about 3 million ha. Rice received a larger budget but gains in productivity have not been realized yet.
In the next three years, rice farm consolidation with mechanization alongside hybrid and inbred seeds can deliver in raising yields. Corn is another crop with potential. They are annual crops.
The tree-crop sector has the potential to contribute, mainly from coconut fertilization and intercropping of cacao and coffee. But time is key here as they have gestation periods.
The 2-3-4 target of Secretary Dar is possible but will need solid support from a restructured bureaucracy, new paradigm and focused budgets. The budgetary support must be anchored on solid road maps with value chain corridors where the interventions are addressed by specific chain segments.
Lastly, the overriding paradigm “Laking Ani, Laking Kita (big harvest, big profits)” is the right trajectory. Production gain is a good target, but profit gain is far more important to farmers and fisherfolks.
Contributions to Growth Analysis, 2001-2018
Crops
2001-2010 – 41.7
2011-2016 – 40.8
2017-2018 – 51.4
Palay
2001-2010 – 14.7
2011-2016 – 29.2
2017-2018 – 34.3
Corn
2001-2010 – 5.7
2011-2016 – 9.4
2017-2018 – 8.9
Coconut
2001-2010 – 3.5
2011-2016 – (6.9)
2017-2018 – 4.9
Sugar
2001-2010 – (1.4)
2011-2016 – 6.5
2017-2018 – 3.4
Banana
2001-2010 – 9.4
2011-2016 – (1.5)
2017-2018 – 4.6
Other crops
2001-2010 – 9.8
2011-2016 – 4.2
2017-2018 – (2.9)
Livestock
2001-2010 – 7.8
2011-2016 – 28.5
2017-2018 – 8.9
Poultry
2001-2010 – 10.9
2011-2016 – 31.7
2017-2018 – 25.1
Fishery
2001-2010 – 31.0
2011-2016 – (27.3)
2017-2018 – (3.7)
Others
2001-2010 – 8.0
2011-2016 – 24.0
2017-2018 – 15.1
TOTAL
2001-2010 – 100.0
2011-2016 – 100.0
2017-2018 – 100.0
Agri annual growth average, percent (a)
2001-2010 – 2.87
2011-2016 – 1.19
2017-2018 – 2.42
World Bank
Source of basic data: Philippine Statistics Authority