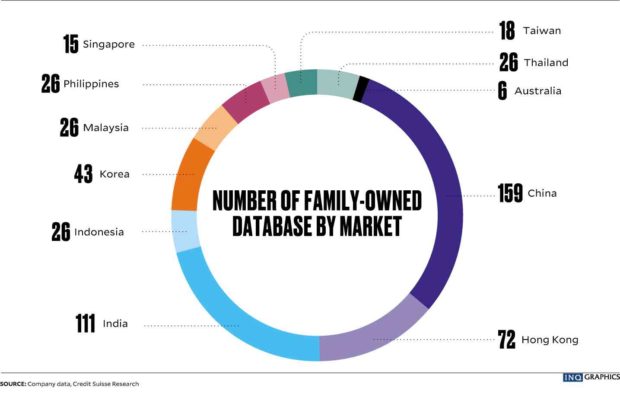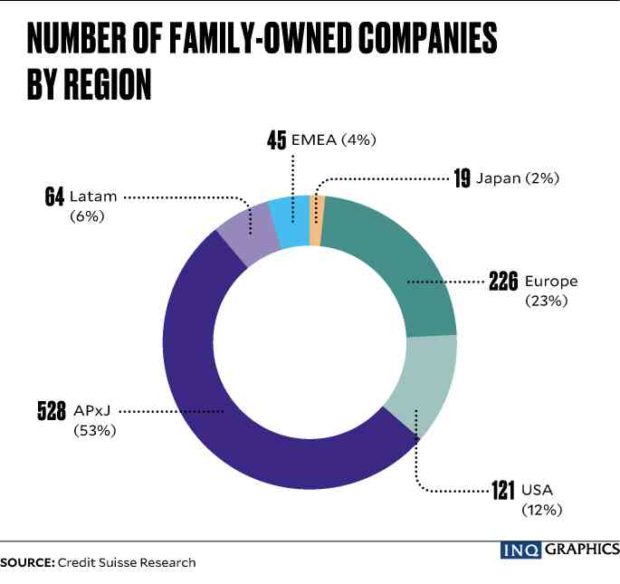
According to the “Credit Suisse Family 1000 in 2018,” the majority of the world’s family-owned businesses come from Asia Pacific, excluding Japan (China, Hong Kong, Taiwan, Singapore, Malaysia, Thailand, Indonesia, the Philippines, Korea, India, and Australia), with a total market capitalization of $4 trillion.
Within the region and globally, China takes top spot, with 159 companies and $1.38 trillion in market capitalization.
Published recently by the Credit Suisse Research Institute (CSRI), the report (available online at www.credit-suisse.com/ch/en/about-us/research/research-institute.html) is an analysis of the think tank’s database of over 1,000 family-owned, publicly listed companies, ranging in size, sector and region.
CSRI looked at these companies’ performance over 10 years compared to the financial and share price performance of a control group consisting of more than 7,000 non-family owned companies globally.
Family-owned businesses, according to the report, meet one of two criteria: direct shareholding by founders or descendants is at least 20 percent; voting rights held by the founders or descendants is at least 20 percent.
In non-Japan Asia, India and Hong Kong take second and third place, respectively, when it comes to number of family-owned businesses.
Together with China, the three make up 65 percent of the region’s section of the CSRI’s database, with a combined market capitalization of $2.85 trillion (71 percent market share).
Korea came in fourth place, with 43 companies ($434.1 billion market capitalization), followed by Indonesia, Malaysia, the Philippines and Thailand, each with 26 companies.

Globally, family-owned businesses in Asia outperformed those in other regions, the report says.
This is based on annual average revenue growth over the past decade: Asia-based family-owned companies’ is at 19.5 percent, North America is at 6.3 percent, and Europe, 7.4 percent.
In terms of annual average total shareholder returns, the Asian family-owned universe achieved 31.5 percent over the same period, compared to 16.6 percent and 9.2 percent achieved by European and North American peers, respectively.
CSRI also found that out of the top 50 most profitable companies globally, 24 were from Asia, with a total market capitalization of $748 billion—a list which includes seven Chinese family-owned companies with a total market capitalization of $522.5 billion.
Family-owned companies in non-Japan Asia are much smaller, too, with market capitalization of less than $3 billion (54 percent).
In Europe and North America, 42 percent and 45 percent, respectively, of family-owned businesses have a market cap of $7 billion or more.
Another key finding on non-Japan Asian family-owned companies: Most tend to be younger, with over 80 percent still under the helm of the first or second generation.
In Japan, half of the companies are third generation family-owned or older, while close to a third of the European companies are fifth generation family-owned or older.
These businesses also deliver stronger revenue growth in all regions and higher levels of profitability, which in turn supports the relative strong share price appreciation seen since 2006.
In 2017 alone, the report states that non-Japan-Asia-based family-owned companies generated over 25 percent greater cash flow return on investment (CFROI) than their non-family owned counterparts, and delivered 4.2 percent outperformance in annual average share price return since 2006.
“This year we find family-owned businesses are continuing to outperform their peers in every region, every sector, whatever their size. We believe this is down to the longer-term outlook of family-owned businesses relying less on external funding and investing more in research and development,” says Eugene Klerk, head analyst of thematic investments at Credit Suisse and the report’s lead author.

