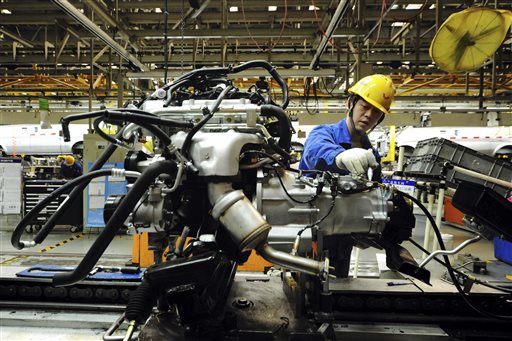
A worker labors on the assembly line of minivans at a SAIC-GM joint venture in Qingdao in eastern China’s Shandong province Tuesday March 1, 2016. AP FILE
Anxiously, the world held its collective breath when China announced its 2016 second quarter GDP growth rate, and then collectively exhaled with great relief when it was again 6.7 percent, the same as in the first quarter. The steady growth, slightly beating forecasts, signaled that China’s economy is well and on course. Stock markets worldwide need not panic.
The initial anxiety and the subsequent relief are both misguided. Neither is entirely justified. At best, GDP growth rates tell only part of China’s economic story.
Consider the widespread displeasure over China’s slowing growth. How terrible is this? Ten years ago, in 2006, when China’s growth rate was a robust 12.7%, everyone was happy – count on China to drive world economic growth! Now everyone is on edge about China. But consider this: the GDP base is far bigger. In 2005, China’s GDP was $2.3 trillion, and 12.7% growth meant an increase of under $300 billion in 2006. Fast-forward ten years. In 2015, China’s GDP was $11 trillion, and 6.5% growth would mean an increase of over $700 billion in 2016 – more than twice the absolute amount the economy grew in 2006 when the growth rate was that happiness-engendering 12.7%. And since China’s population in 2016 is only marginally more than it was in 2006, the absolute amount of GDP growth per capita will be well more this year than it was a decade ago.
That’s the good news. But there’s complexity, pulling in the opposite direction.
What are the components of the growth rate? What sectors are driving it? Investment looms large, so we must ask: how productive are those assets being formed? Massive industrial overcapacity is China’s most serious economic impediment. Debt-fueled investments in fixed assets – particularly via government stimulus programs (needed for economic stability) – have rendered some investments unproductive or even counterproductive (they cost money to maintain).
While we cannot know in real time how much unproductive assets are embedded in each year’s GDP growth rate, we do know for sure that some of the growth of past years now sit as overcapacities – coal, iron, steel, cement, glass, heavy equipment, chemicals, housing, etc.
So, on the one hand, the GDP growth rate on a much larger base continues to impress, but on the other hand, some of that growth is unproductive. Yet, there is real growth in consumer products, e-commerce and service industries.
It is difficult to figure out what is really going on.
Obviously, we need GDP growth rates for standardization and benchmarking, but we should not deify them. It’s no surprise that they dominate discourse. GDP growth rate is a simple, single number, seemingly easy enough to understand. That’s its power. That’s also its problem.
How else to assess the economy? I follow China’s national policies, seek indicators to discern progress (or not).
“Supply side structural reform” is critical for reducing overcapacity and corporate debt. Progress in the former could be assessed by, say, an increasing number of corporate bankruptcies – closing down “zombie” enterprises would be a good thing, not a bad thing. It’s no state secret that some state-owned enterprises (SOE) are moribund, and so a leading indicator that the government is willing to make hard choices and endure short-term pain to achieve long-term gain would be an uptick in the number of SOE bankruptcies. Similarly, progress in reducing corporate debt would be an increase in debt-for-equity swaps.
Another indicator is the percentage of non-performing loans (NPL) issued by banks, largely to SOEs. Analysts estimate the real NPL rate to be between 10% and 20%. To me, a positive indicator of economic progress would be an increase in officially reported NPLs, because it would mean that the government is ready to clean up the financial system, which is necessary for sustainable growth.
I also focus on China’s overarching guidelines for economic and social transformation. Put forth by President Xi, the Five Major Development Concepts are the highest-level drivers of national policy: innovation, coordination, green, openness and sharing.
So, take note of the quarterly GDP, sure, but watch other indicators as well.

